Socio-Hydrology: Dynamical Systems Representation of Hazards and Society

Socio-hydrology models explore interactions between human and hydrological systems, enabling the analysis of dynamic feedbacks between society and flooding. Simplified conceptual models of socio-hydrology often treat the social or human domain as single homogenous entities, failing to account for disparities among the communities that make of a city, and thus underestimating the true impacts of flooding on vulnerable populations. We propose a disaggregated socio-hydrology model that incorporates a Resilience domain to capture differences among communities within a single city. Using empirical socioeconomic data from United States metropolitan areas, we inform the model's representation of inequality and its influence on community-level adaptive capacities. With the further addition of a disaster relief component, our approach captures community-specific recovery trajectories, linking economic inequalities to urban flood resilience. Results show that a community's adaptive capacity is shaped by a city's overall growth rate and the degree of economic disparities between communities. We find that improving a city's economic growth rate can unintentionally widen disparities in community adaptive capacity, consistent with the Kuznets curve hypothesis. However, simulations show that equitable resource allocation reduces recovery gaps without hindering overall city growth. Our results emphasize the necessity of incorporating socioeconomic heterogeneity into socio-hydrological models to inform equitable disaster response policies. By grounding resilience in empirical economic data, this study advances socio-hydrology modeling to provide more actionable insights for disaster response and community-based risk reduction strategies.

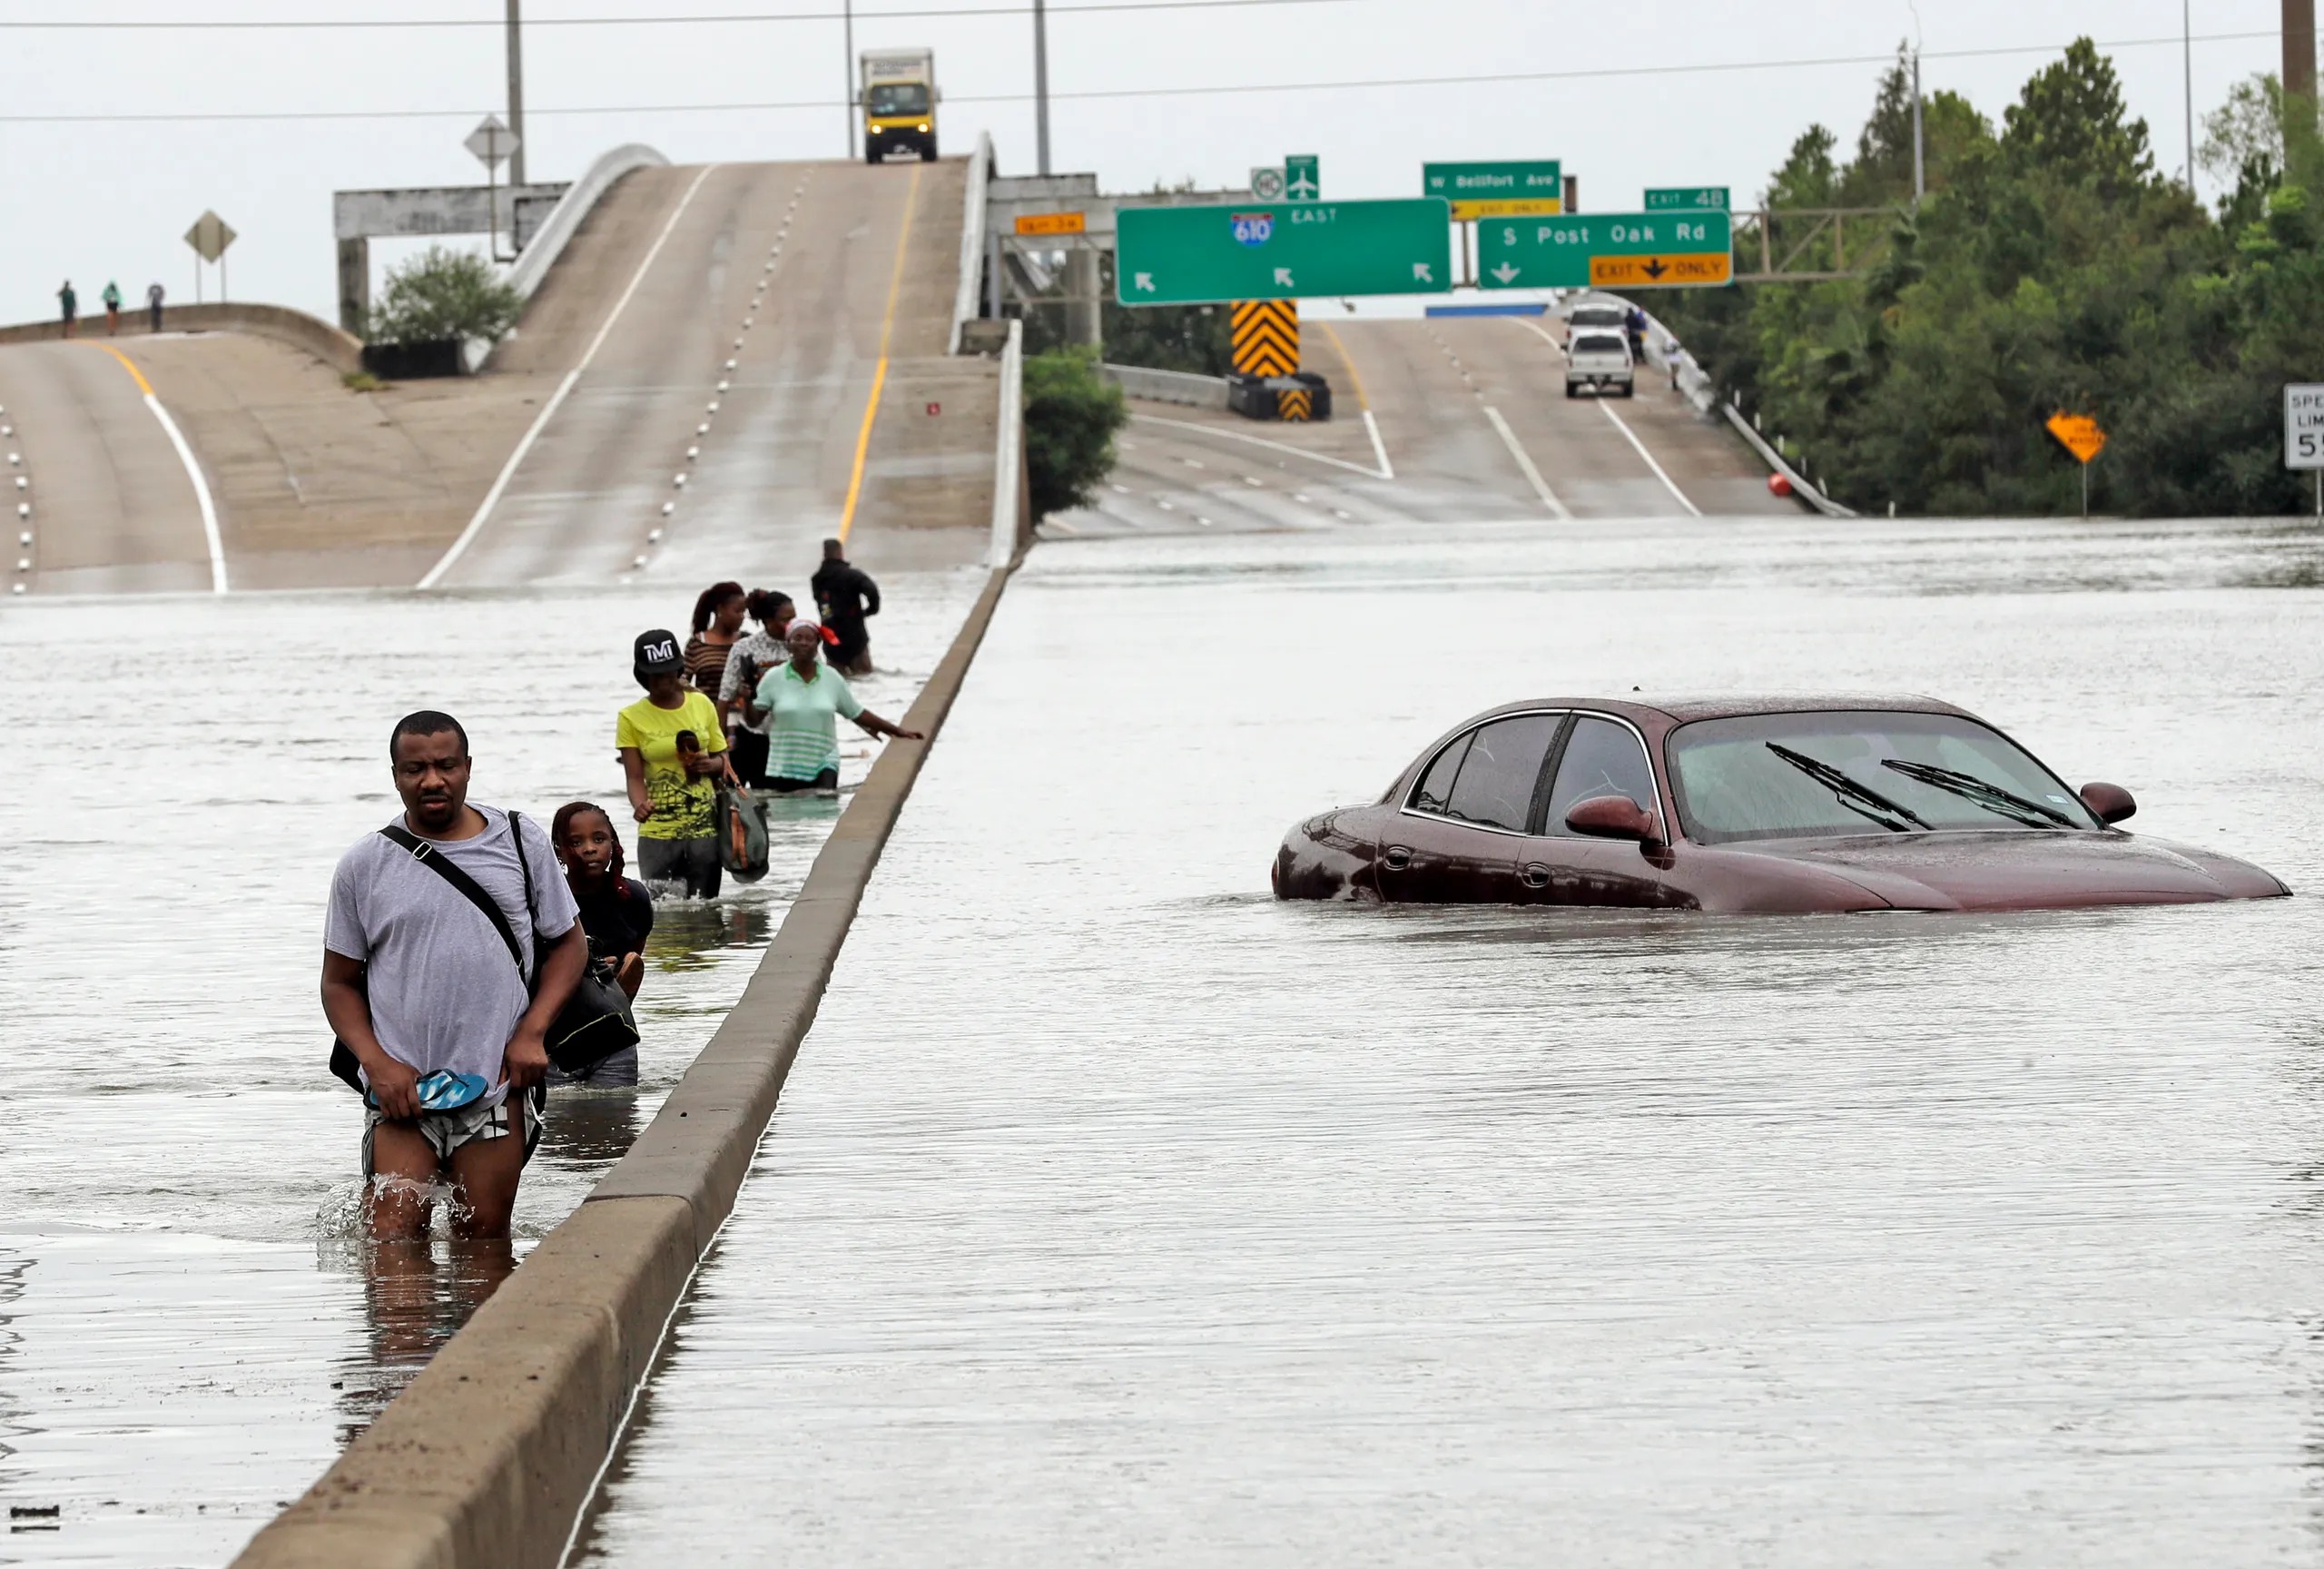
Harvey flooded roadway (2017)
Hurricane Harvey turned Houstonss roads into rivers. Photograph by David J. Phillip / AP

Using Daily Satellite Imagery to Detect Multi-Hazard Events

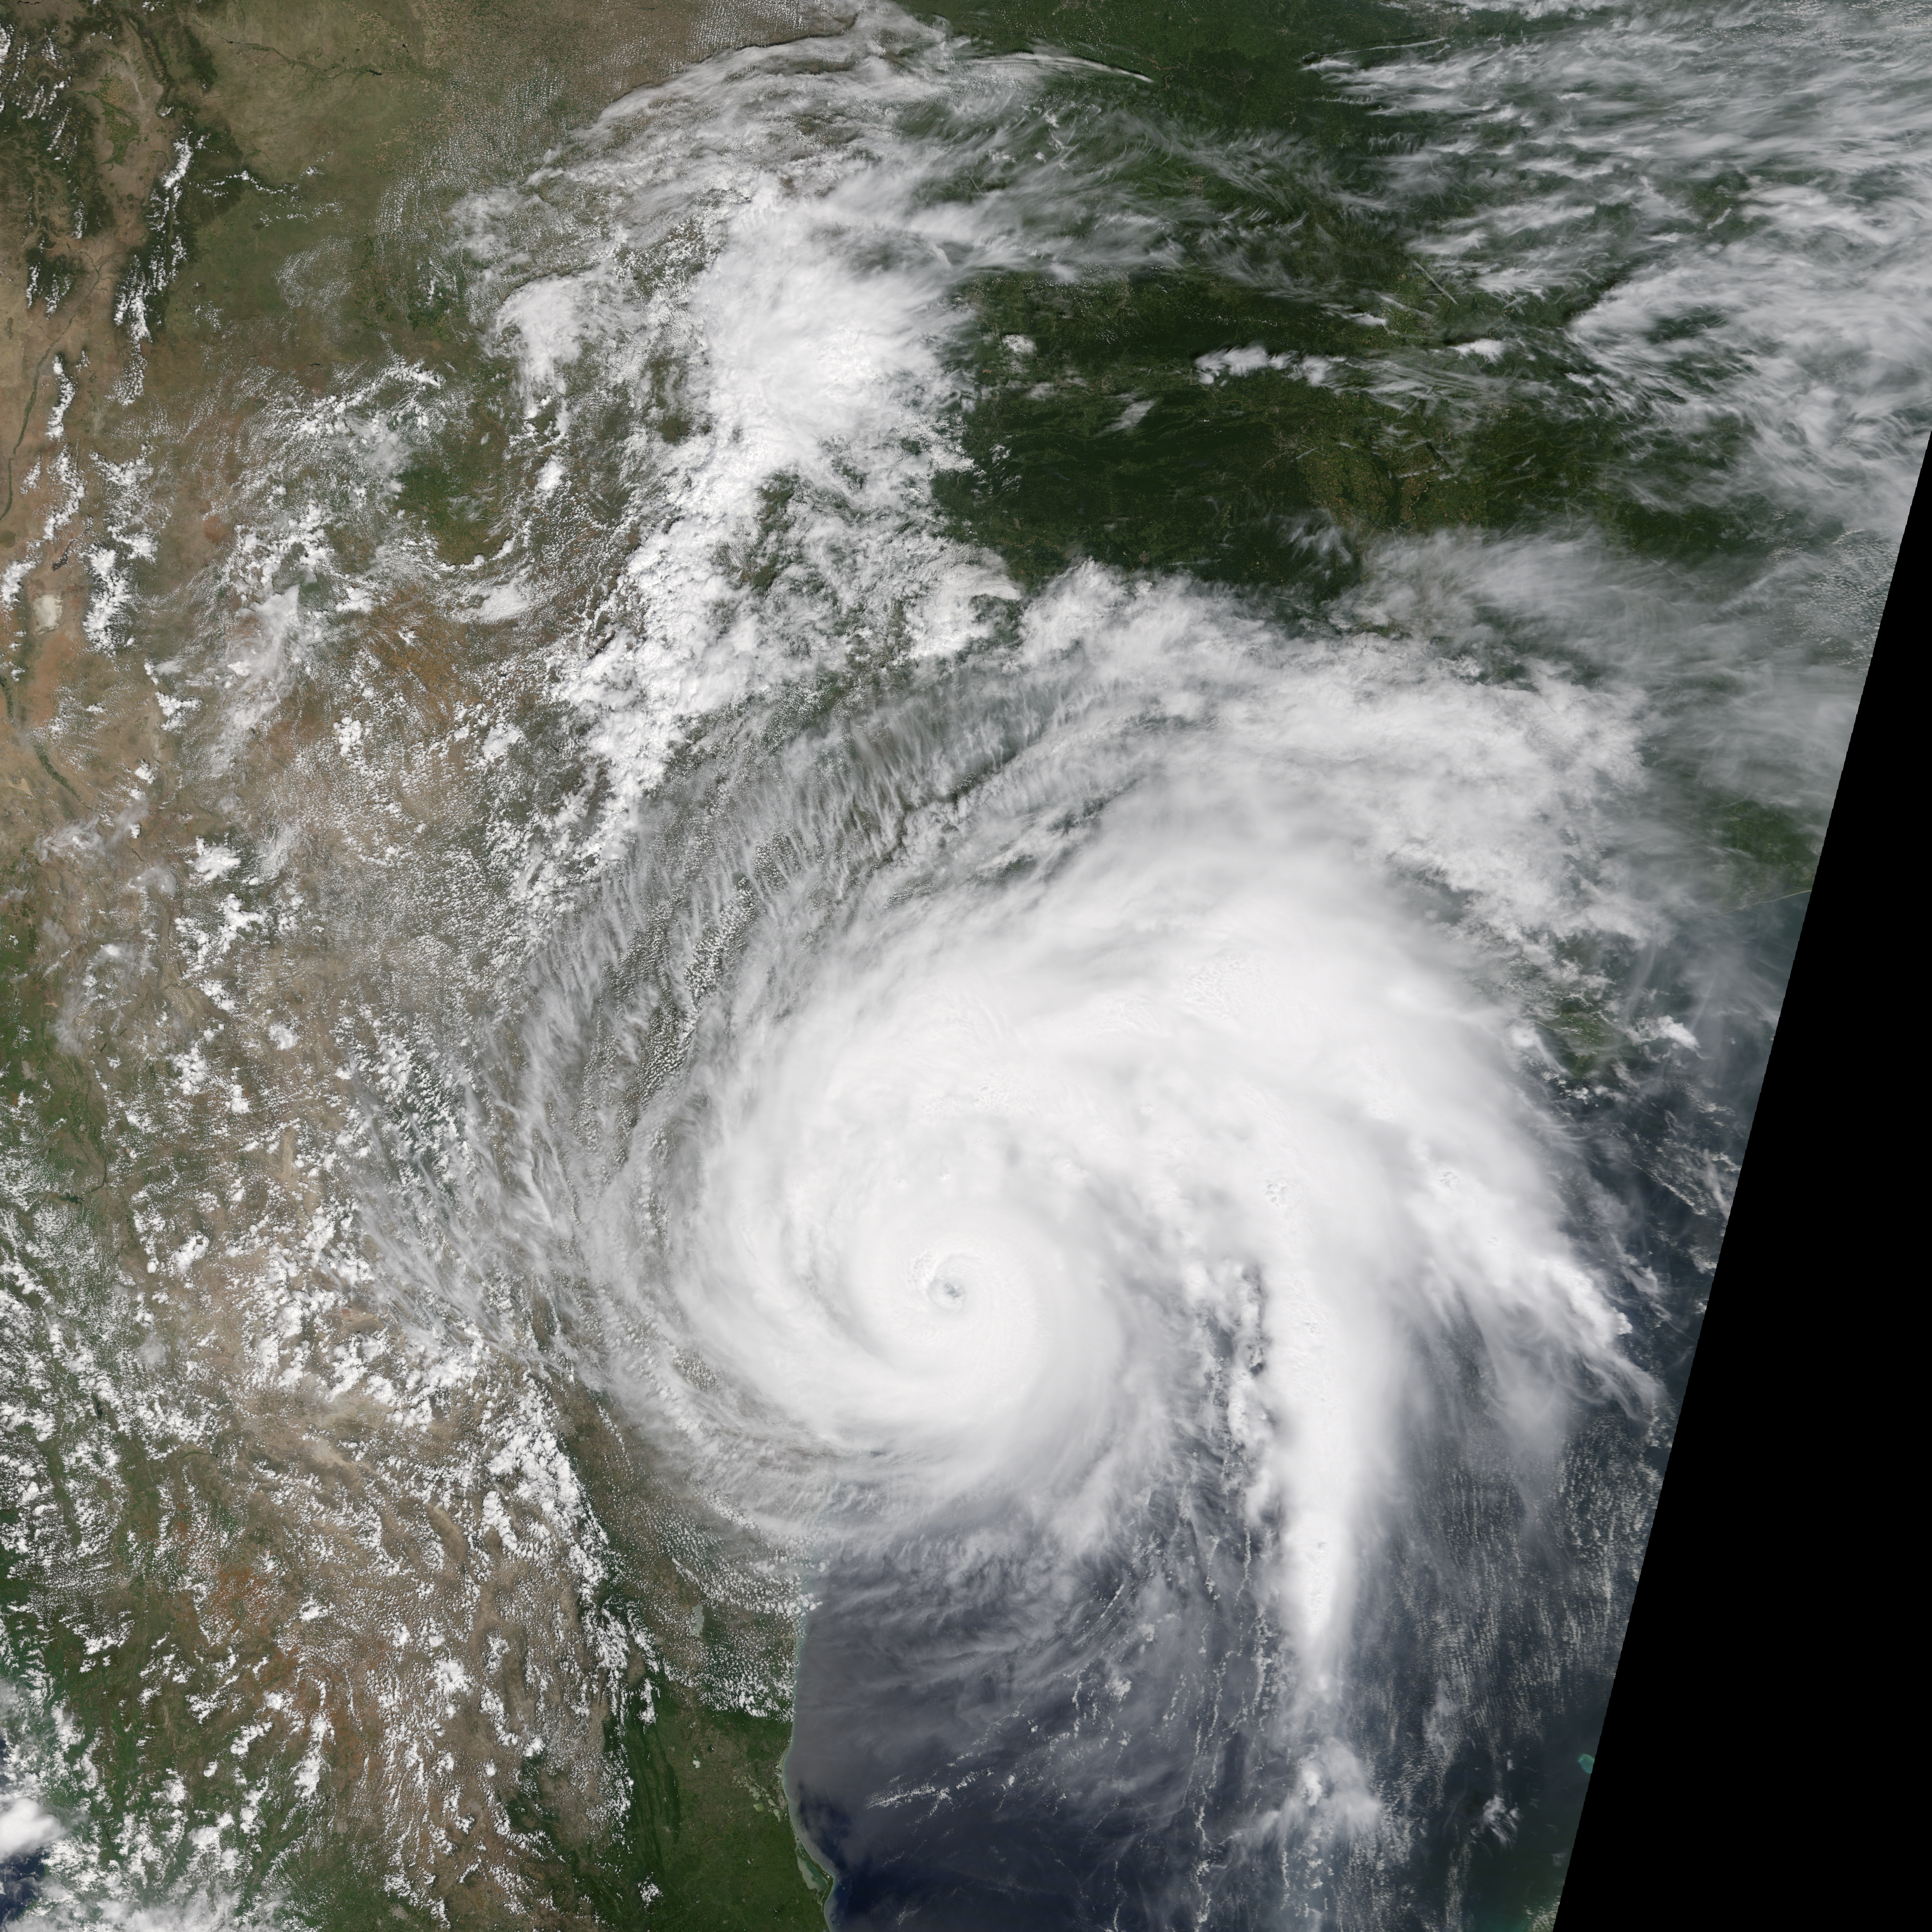
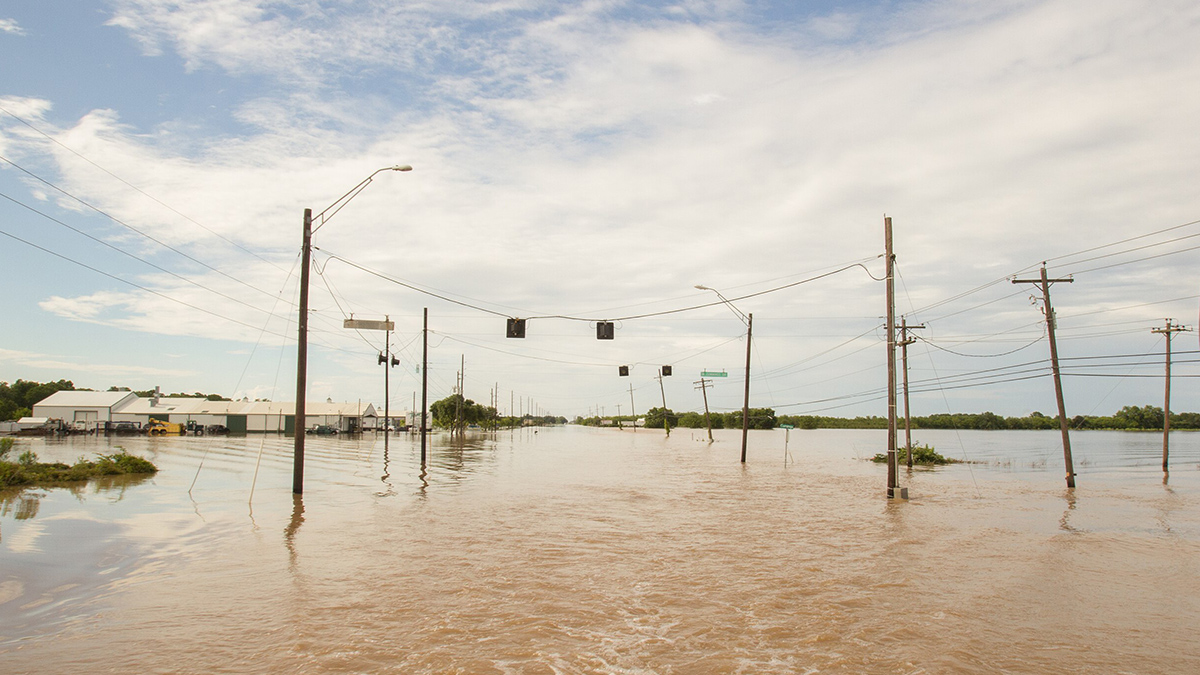
Expanding hazard detection capabilities is critical as climate extremes intensify. This study demonstrates the potential of daily satellite data to address limitations in current global hazard detection methods, which often exclude localized and life-threatening events like flash floods and extreme heat within expected climatological ranges. Using an open-source framework, we identified 2.5 times more flood events in Texas, equating to $320 million in damages, and increased the detected area of heat hazards by 56.6%, covering 91.5 million square kilometers over 18 years. These advancements improve hazard monitoring, enabling more accurate assessments of climate risks and hazard exposure inequities. Enhanced detection of multi-hazard events supports better-informed responses to growing climate challenges worldwide.

Local or regional flash flooding events often go undetected by satellite instruments. New research aims to increase detection of multihazard events, such as combined extreme heat and flooding. Credit: Capt. Aaron Moshier, Texas Military Department

Critical Resource Accessibility during Extreme Flood Events

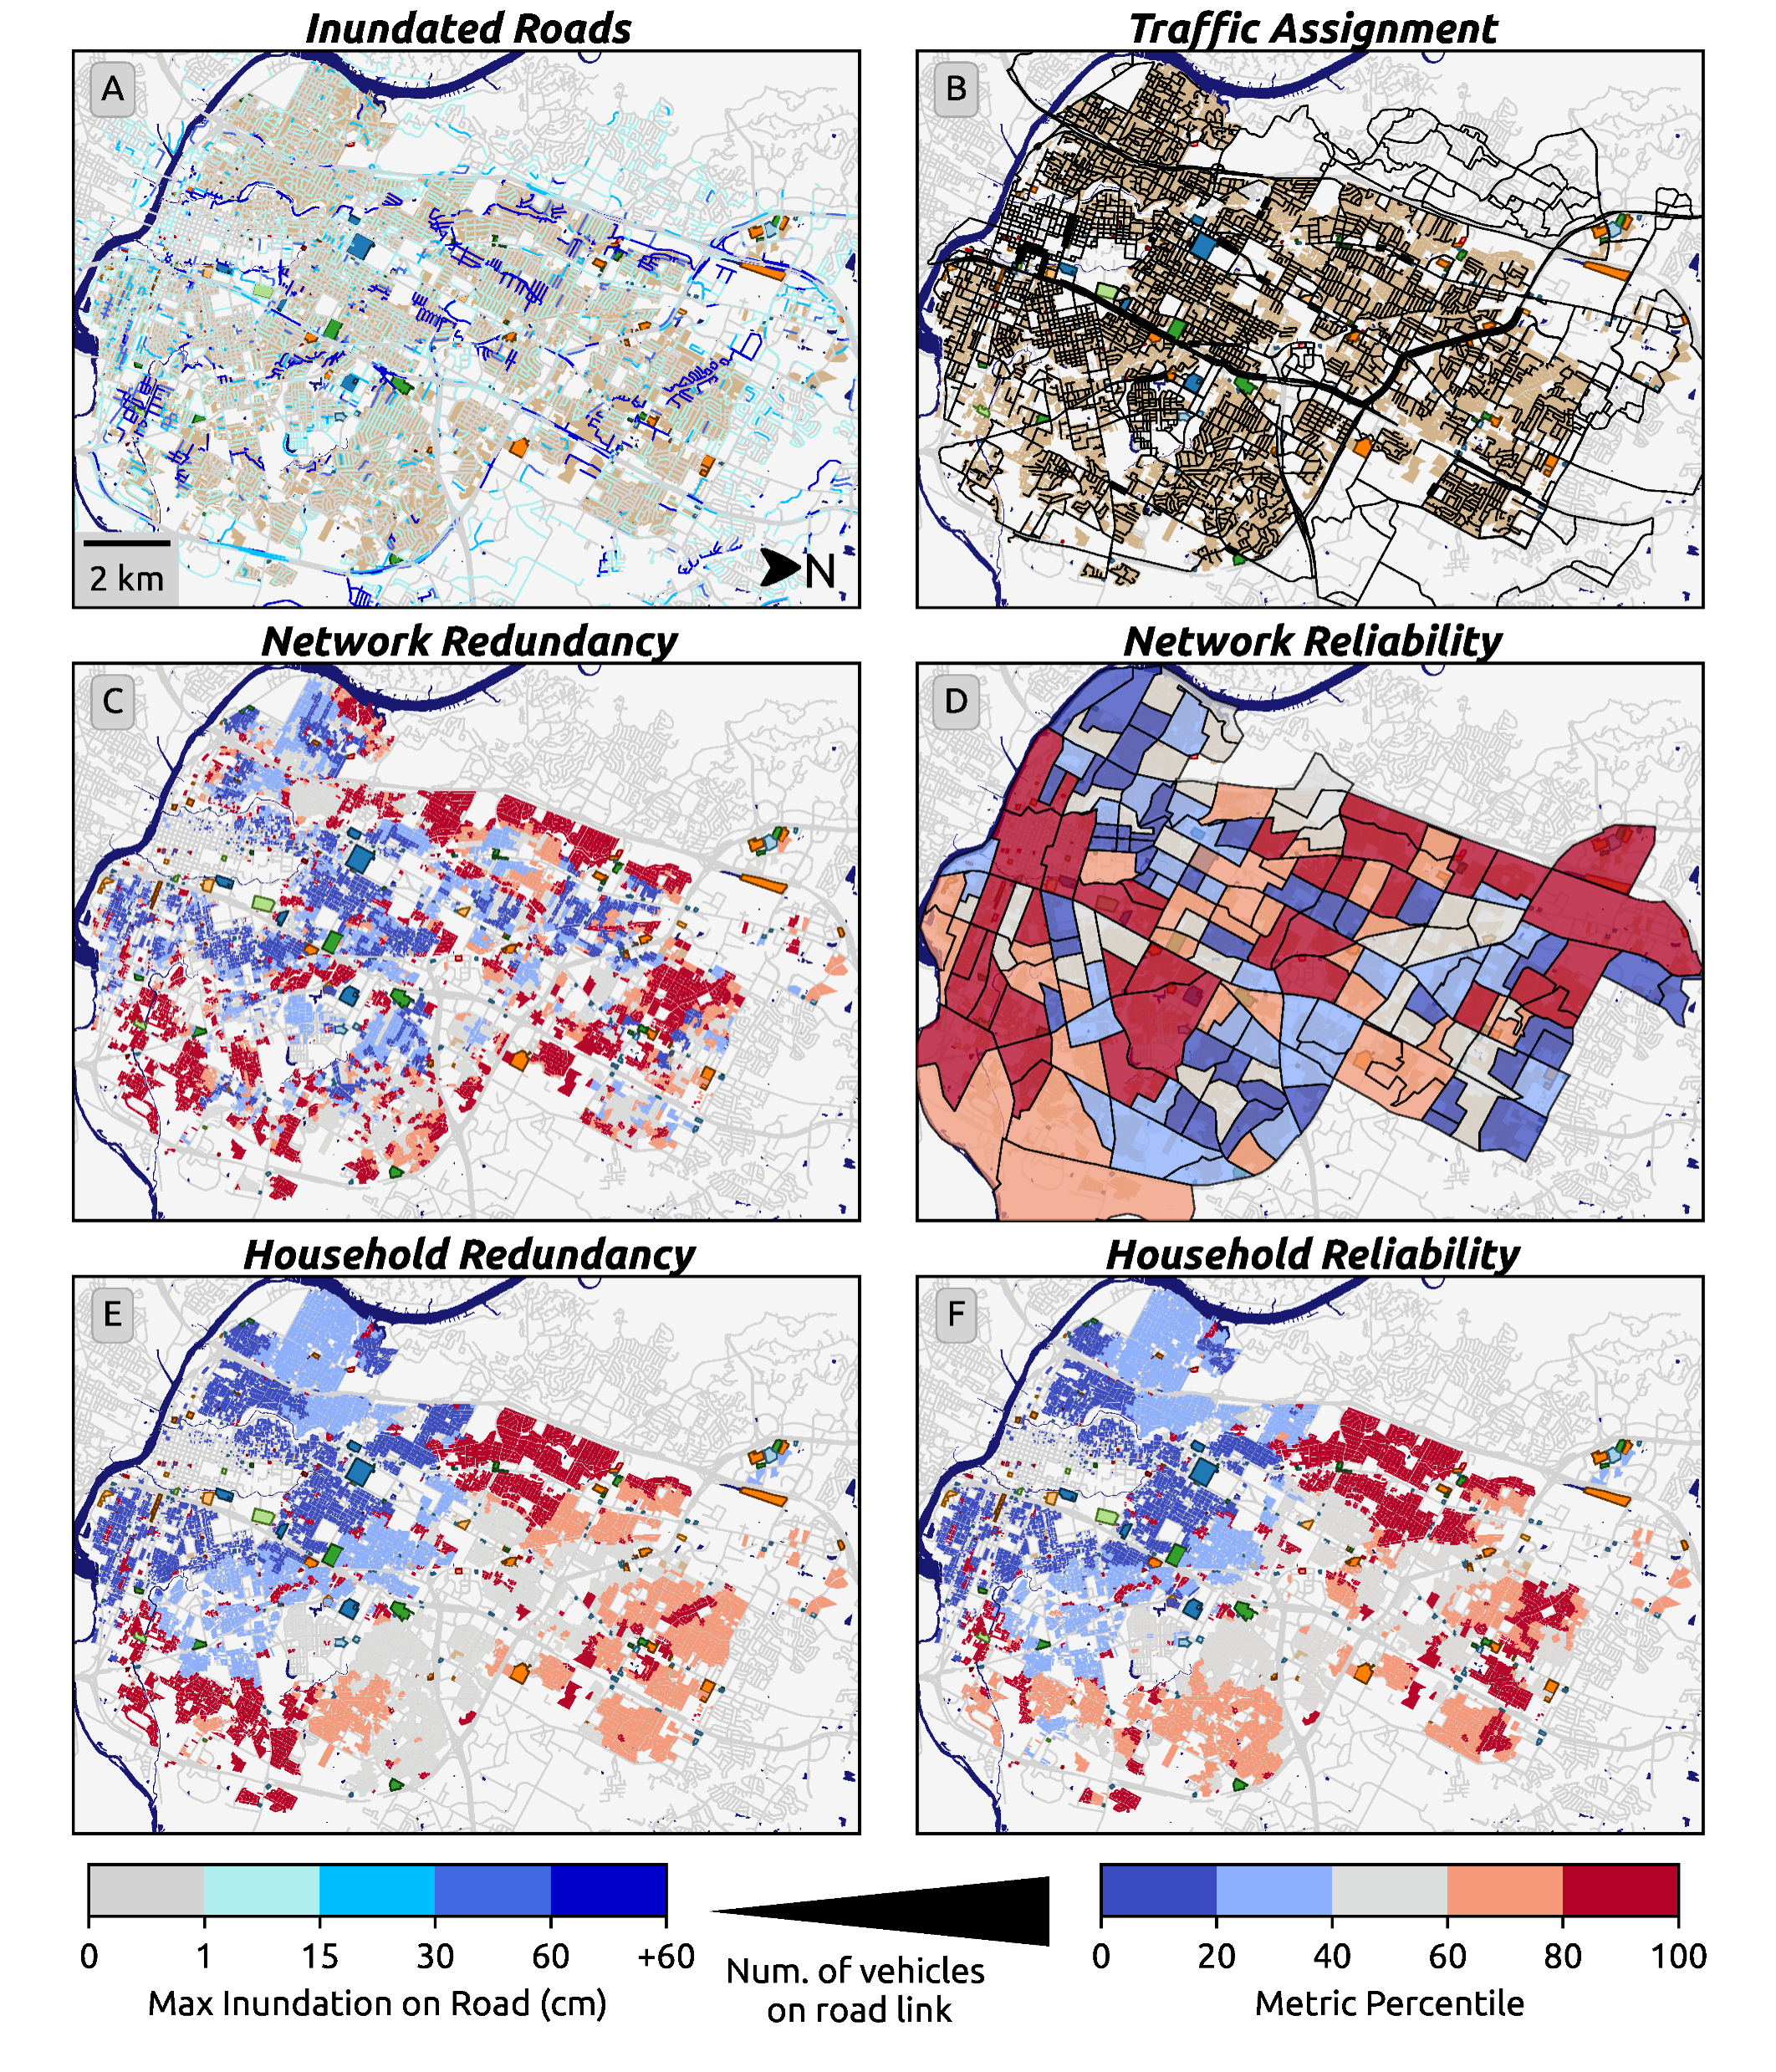
Numerous government and non-governmental agencies are increasing their efforts to better quantify the disproportionate effects of climate risk on vulnerable populations with the goal of creating more resilient communities. Sociodemographic based indices have been the primary source of vulnerability information the past few decades. However, using these indices fails to capture other facets of vulnerability, such as the ability to access critical resources (e.g., grocery stores, hospitals, pharmacies, etc.). Furthermore, methods to estimate resource accessibility as storms occur (i.e., in near-real time) are not readily available to local stakeholders. We address this gap by creating a model built on strictly open-source data to solve the user equilibrium traffic assignment problem to calculate how an individual's access to critical resources changes during and immediately after a flood event. Redundancy, reliability, and recoverability metrics at the household and network scales reveal the inequitable distribution of the flood's impact. In our case-study for Austin, Texas we found that the most vulnerable households are the least resilient to the impacts of floods and experience the most volatile shifts in metric values. Concurrently, the least vulnerable quarter of the population often carries the smallest burdens. We show that small and moderate inequalities become large inequities when accounting for more vulnerable communities' lower ability to cope with the loss of accessibility, with the most vulnerable quarter of the population carrying four times as much of the burden as the least vulnerable quarter. The near-real time and open-source model we developed can benefit emergency planning stakeholders by helping identify households that require specific resources during and immediately after hazard events.

Network Accessibility map from Preisser et al., 2023
Resource accessibility model outputs including network and household scale redundancy and reliability metrics from Preiser et al., 2023

Near-Real-Time Urban Compound Flooding Impact

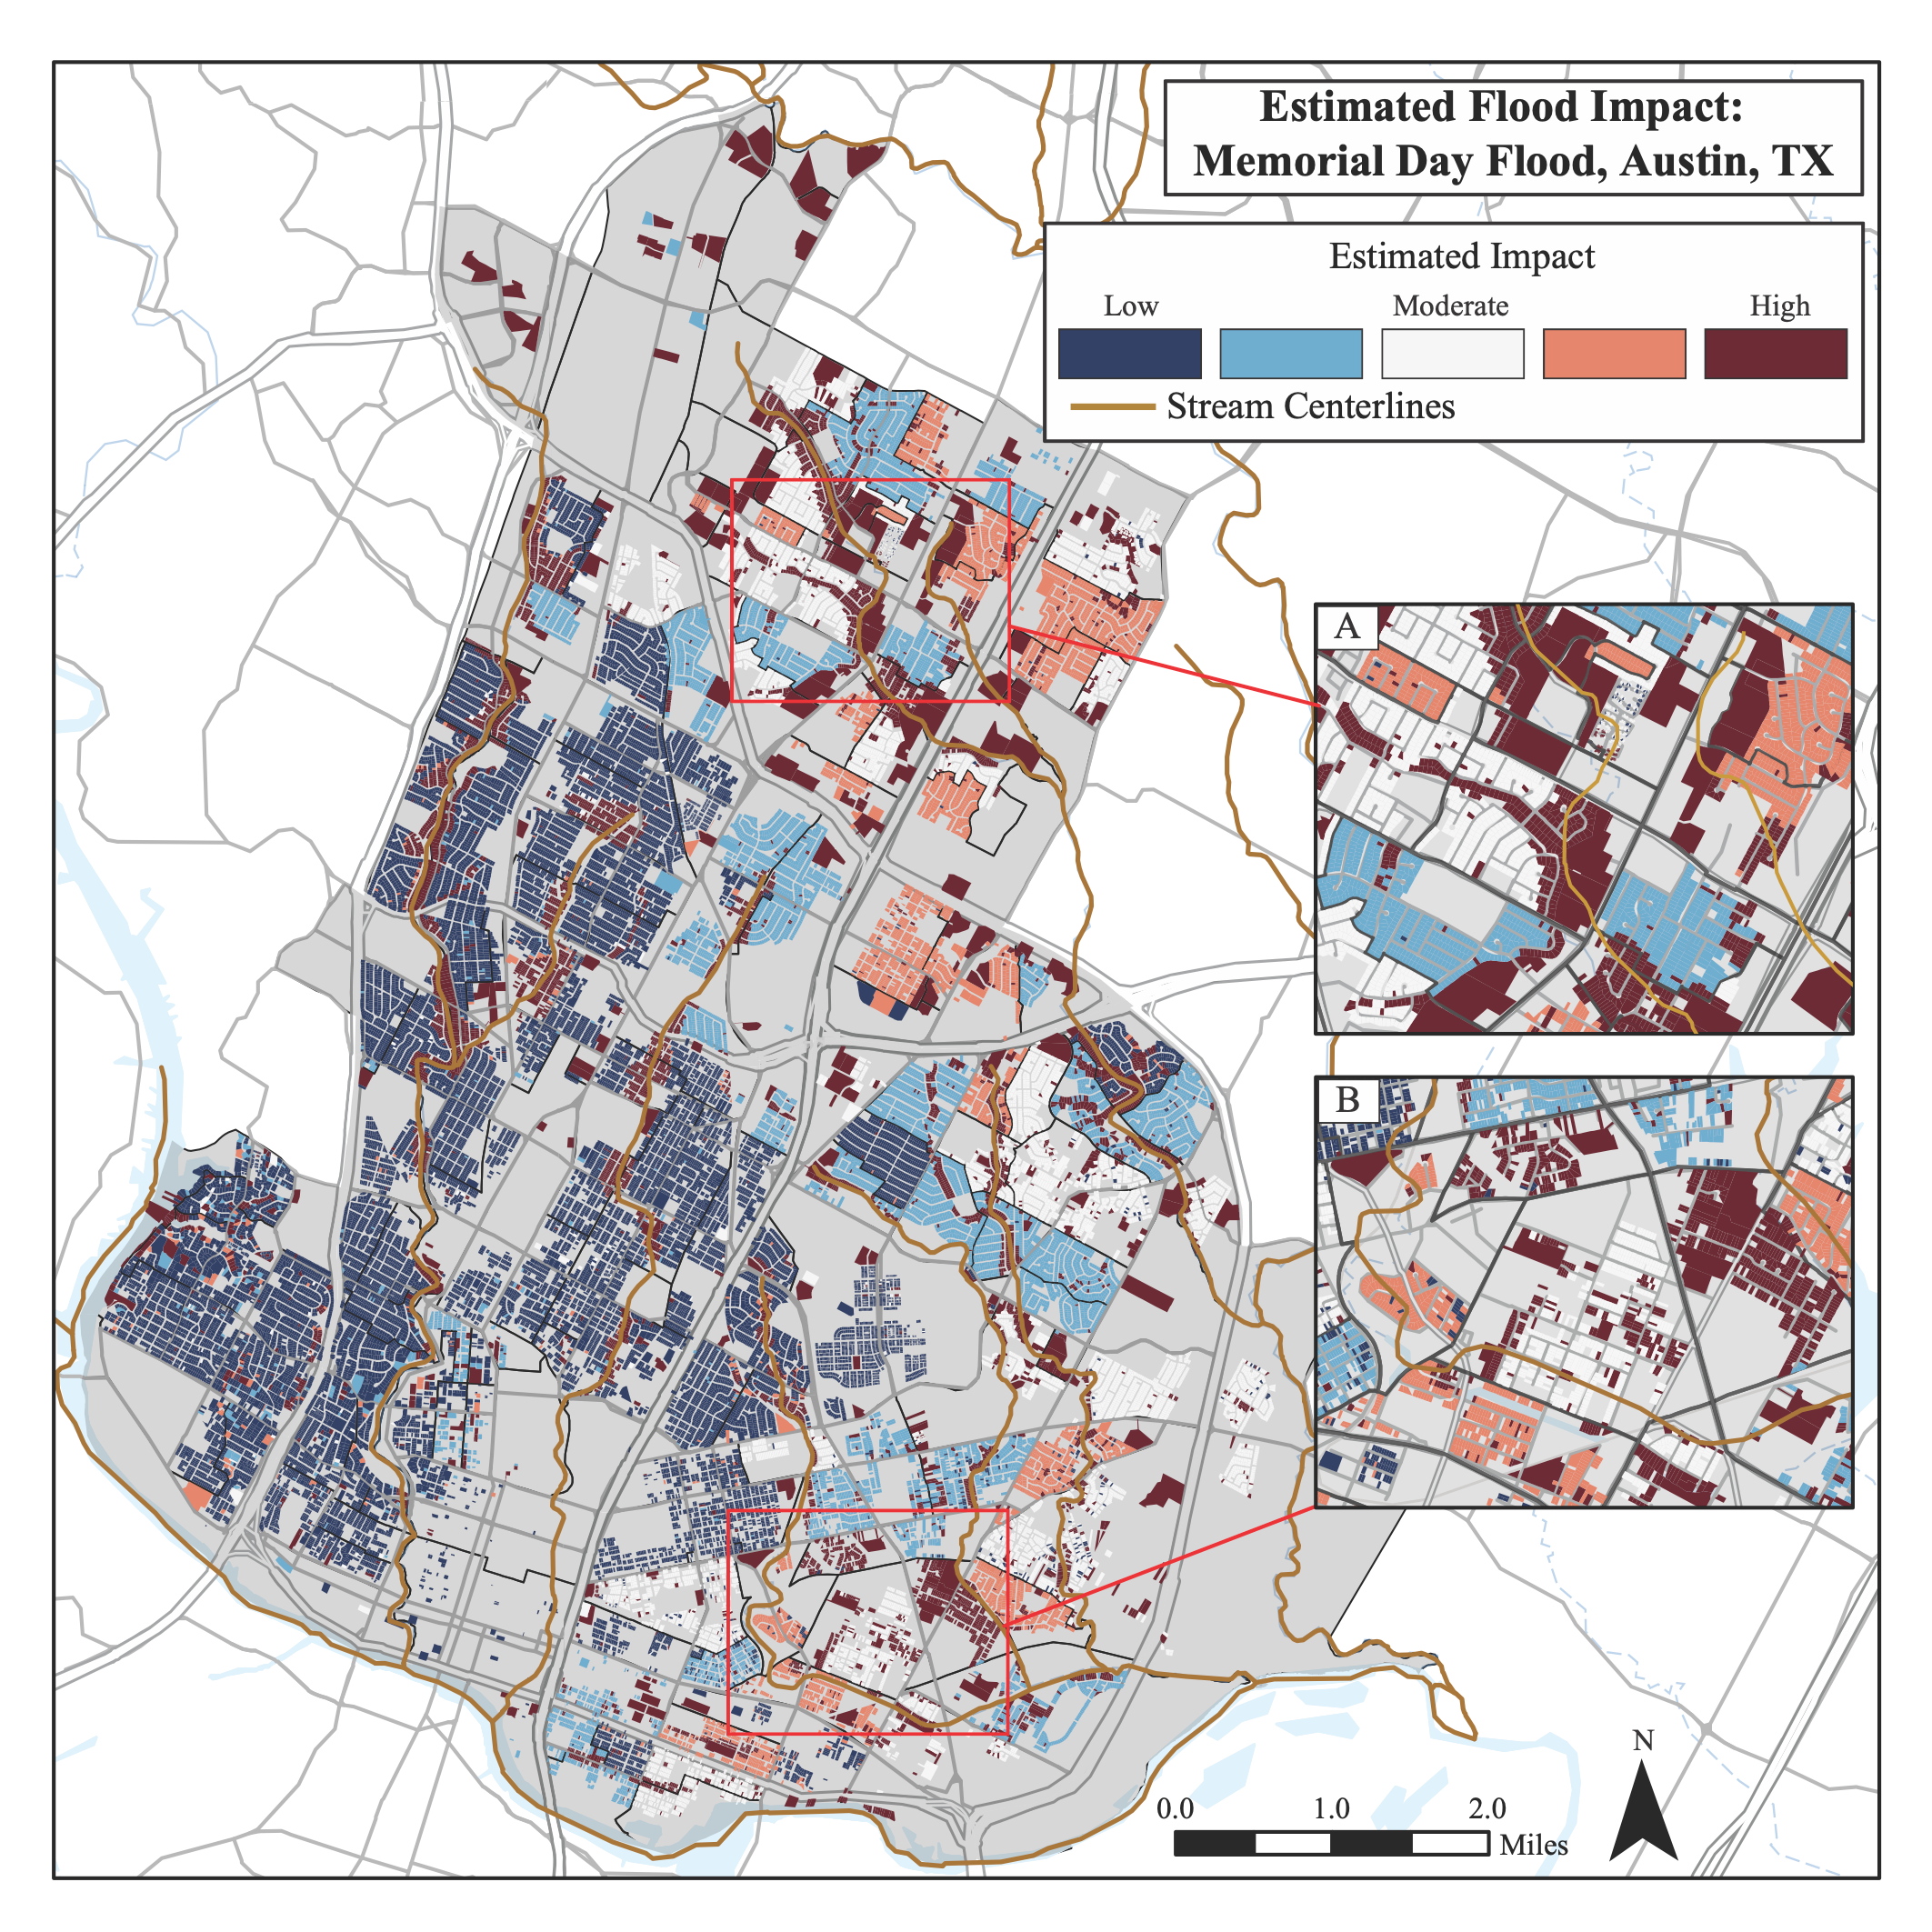
Increased interest in combining compound flood hazards and social vulnerability has driven recent advances in flood impact mapping. However, current methods to estimate event-specific compound flooding at the household level require high-performance computing resources frequently not available to local stakeholders. Government and non-governmental agencies currently lack the methods to repeatedly and rapidly create flood impact maps that incorporate the local variability in both hazards and social vulnerability. We address this gap by developing a methodology to estimate a flood impact index at the household level in near-real time, utilizing high-resolution elevation data to approximate event-specific inundation from both pluvial and fluvial sources in conjunction with a social vulnerability index. Our analysis uses the 2015 Memorial Day flood in Austin, Texas, as a case study and proof of concept for our methodology. We show that 37% of the census block groups in the study area experience flooding from only pluvial sources and are not identified in local or national flood hazard maps as being at risk. Furthermore, averaging hazard estimates to cartographic boundaries masks household variability, with 60% of the census block groups in the study area having a coefficient of variation around the mean flood depth exceeding 50%. Comparing our pluvial flooding estimates to a 2D physics-based model, we classify household impact accurately for 92% of households. Our methodology can be used as a tool to create household compound flood impact maps to provide computationally efficient information to local stakeholders.

Flood Impact for the Austin, Texas during the 2015 Memorial Day Flood
Flood Impact for the Austin, Texas during the 2015 Memorial Day Flood, taken from Preisser et al., 2022