SVInsight Example: Southeast Texas
[1]:
# Example notebook to compute SVInsight
# Script to compute the Social Vulnerability Index according to the SVInsight method of Preisser et al. (2024). This example shows how to compute the index for the counties in Southeast Texas with geoids 4819, 48245, 48361, 48241, 48351.
# Created on 28 April 2024
[1]:
# After installing SVInsight (and all dependencies) with pip install, we can import it into this notebook:

from svinsight import SVInsight as svi
[2]:
# Set the necessary variables and create the SVInsight object. In this example we are using counties in Southeast Texas:
project_name = 'SETx_SVI'
file_path = "C:/Users/pp7545/Documents/research/SVInsight"
api_key = 'your api key here'
geoids = ['48199', '48245', '48361', '48241', '48351']
project = svi(project_name, file_path, api_key, geoids)
[3]:
# In this example we will estimate the SVI for the Southeast Texas counties using data from 2021 at the block group level:
boundary = 'bg'
year = 2021
config_file = 'config_file'
[4]:
# We now follow the simplest workflow:
#1. extract boundaries
#2. extract census data
#3. configure variables
#4. calculate social vulnerability index

project.boundaries_data(boundary, year)
project.census_data(boundary, year)
project.configure_variables(config_file)
project.calculate_svi(config_file, boundary, year)
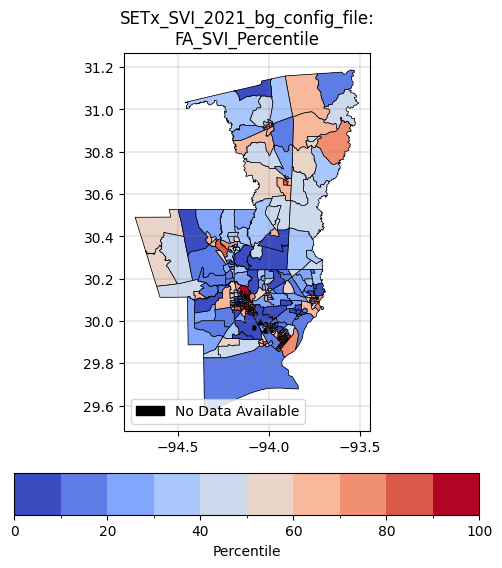
[5]:
# The output SVI.csv and .gpkg are stored in the following file format:
# folder location: {file_path}/{project_name}/{SVIs}/
# file name: {project_name}_{year}_{boundadry}_{config_file}_svi

# We can load the results and plot them here:

import matplotlib.pyplot as plt
geopackages = [2021, boundary, config_file, 'FA_SVI_Percentile']
figure = project.plot_svi(1, geopackages)
plt.show()
