Understanding Iterative Factor Analysis Results
One of the outputs of the SVI workflow is an excel file containing documentation describing the characteristics of the index. This file can be found in the Documentation project folder and has the following naming convention:
folder location:
{file_path}/{project_name}/{Documentation}/file name:
{project_name}_{year}_{boundary}_{config_file}.xlsx
Each tab of the excel sheet contains pertinent information regrading the iterative factor analysis SVI. The below subsections discusses what information is stored in each sheet and shows examples from an SVI run using the standard set of 27 variables (see background for more information) for Travis County, Texas in 2017 at the block group level.
Significant Components
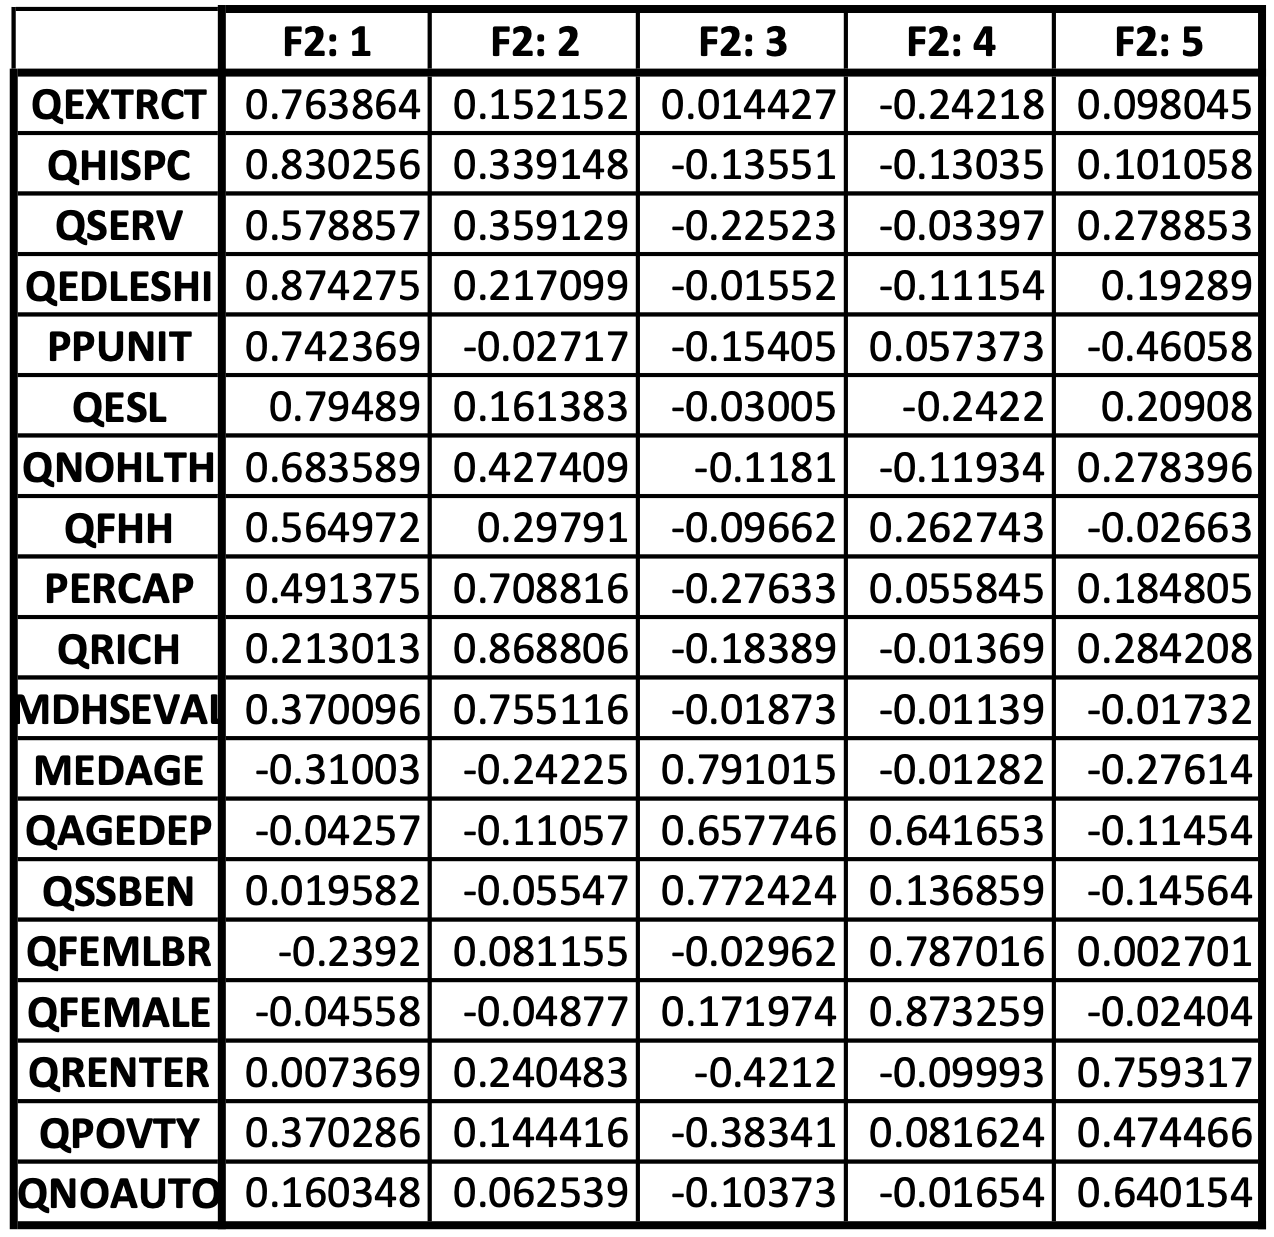
This sheet shows what components are significantly contributing to each factor from the final factor analysis. The number of iterations can be determined based on the name of each factor. For example, in this run ‘F2’ means that this went through three rounds of factor analysis (zero-based numbering rules). As can be seen, there are 5 factors in the final index. Information on which variables contribute to which factor is useful in determining “themes” for the factors (e.g., wealth theme, social characteristics theme, etc.). In this example, one could identify the first factor as Social Status, and the second factor as Economic Status. These are for description only and will be unique based on the study area and year being analyzed. They may or may not be easily definable into distinct themes, but do show what variables are correlated within a study area.

Table 1: Significant components for 2017 Travis County, Texas Block Group SVI estimate
Loading Factors
Based on the variables within the final index, each has a loading factor associated with it for each factor. This information is critical in determining the weights for each variable for each factor when calculating the final index. For every boundary in the study area and for every factor, the variable is multiplied by the loading factor and summed within each factor. This is how the factor scores are determined.

Table 2: Loading factors for 2017 Travis County, Texas Block Group SVI estimate
All Refactor Variances
This shows the four main variance statistics associated with a factor analysis for each iteration.
SS Loadings: The sum of the squared loadings for the factor. If a factor’s SS loading is greater than 1 it is worth keeping.
Proportion Variance: The proportion of the variance that a factor accounts for. The first factor will have the highest proportion, due to our rotation earlier, and subsequent factors will have a decreasing proportion of explained variance. When calculating the final index, each factor is multiplied by its proportion of variance to weight the variables.
Cumulative Variance: The cumulative sum of the variance that is explained with each factor. The overall cumulative variance is how much of the original system’s variables are explained with this new reduced dimensionality. This is important because it shows us how much of the original data’s variance we are losing. If we are losing too much, then we need to reconsider how many factors we have reduced down to. If it is too close to 100% then we can theoretically reduce down more.
Ratio Variance: Ratio of proportion of variance to cumulative variance.
For most studies, especially exploratory analyses, it is acceptable to have a cumulative variance as low as 60%, and sometimes as low as 50% [1] [2] [3] .
Final Variances
An abbreviated version of All Refactor Variances, showing only the final table for the final iteration.

Table 4: Final factor analysis variance statistics for 2017 Travis County, Texas Block Group SVI estimate
Included and Excluded
contains the lists of what variables make the final index and which variables are excluded due to not significantly contributing to a any factors. This can be useful for double checking that the index is including variables you would likely expect to find given your study area.